

You are now on the AHDB Horticulture and Potatoes website.
Please click here to access the main AHDB website and other sectors.
Please click here to access the main AHDB website and other sectors.
Nitrogen (N) fertiliser recommendations for potatoes are partly based on the intended length of the growing season and the Nitrogen Group of the variety being grown (AHDB Nutrient Management Guide (RB209), Section 5: Potatoes).
Nitrogen groups of new varieties are usually derived from the results of numerous nitrogen response experiments, which are time-consuming and expensive. AHDB project 11140044 has shown that counting the number of leaves on a main axis of potato plant is a reliable indicator of the nitrogen group and is suitable for use where stocks of a new variety are limited.
There are four nitrogen groups for potatoes:
|
|
Group 1 |
Group 2 |
Group 3 |
Group 4 |
|---|---|---|---|---|
|
Degree of determinacy |
Very determinate |
|
|
Very indeterminate |
|
Leaf production capacity |
May cease leaf production after it has initiated its first flower |
|
 |
Variety may continue to produce tiers of leaves and flowers until curtailed by decreasing day length or frost |
|
Examples |
Accord, Estima and Innovator |
|
|
Cara, Markies and Royal |
A Group 1 variety may need twice the N fertiliser application when compared with a Group 4. Giving too little or too much N fertiliser to a potato crop often results in loss of yield and may also affect tuber dry matter concentration.
To work out the nitrogen group of a new variety, it is best to grow it alongside other, contrasting varieties of known nitrogen grouping under similar conditions. Group 1 and Group 4 varieties are recommended as reference varieties.
Table 1. Preparation and input requirements
|
Input |
Requirements |
|
Nitrogen application rate |
Relatively low to ensure that the most indeterminate variety has started to senesce at the end of your test period |
|
Soil |
As uniform an area as possible with similar texture, organic matter content and rooting depth |
|
Nutrition, irrigation and crop protection |
Adequate supply of P, K and Mg; irrigation scheduled to ensure limiting soil moisture deficits are not exceeded and crop protection applied according to best practice |
|
Seed |
Ideally, high-health seed. The seed should be of a similar size, chronological and physiological age, and planted at a similar depth to encourage concurrent emergence |
|
Plots |
Multiple plots that are replicated and randomised If seed is limited, single plots of guarded plants (e.g. three-row plot with observations made on middle row) could be used but N groupings are unlikely to be as accurate |
Although counting the number of leaves is both simple and quick (and may be non-destructive if leaves are counted in-situ), follow this method so that leaves are counted in a consistent way. It will be important to be able to identify:
These form the ‘main axis’ of the plant.
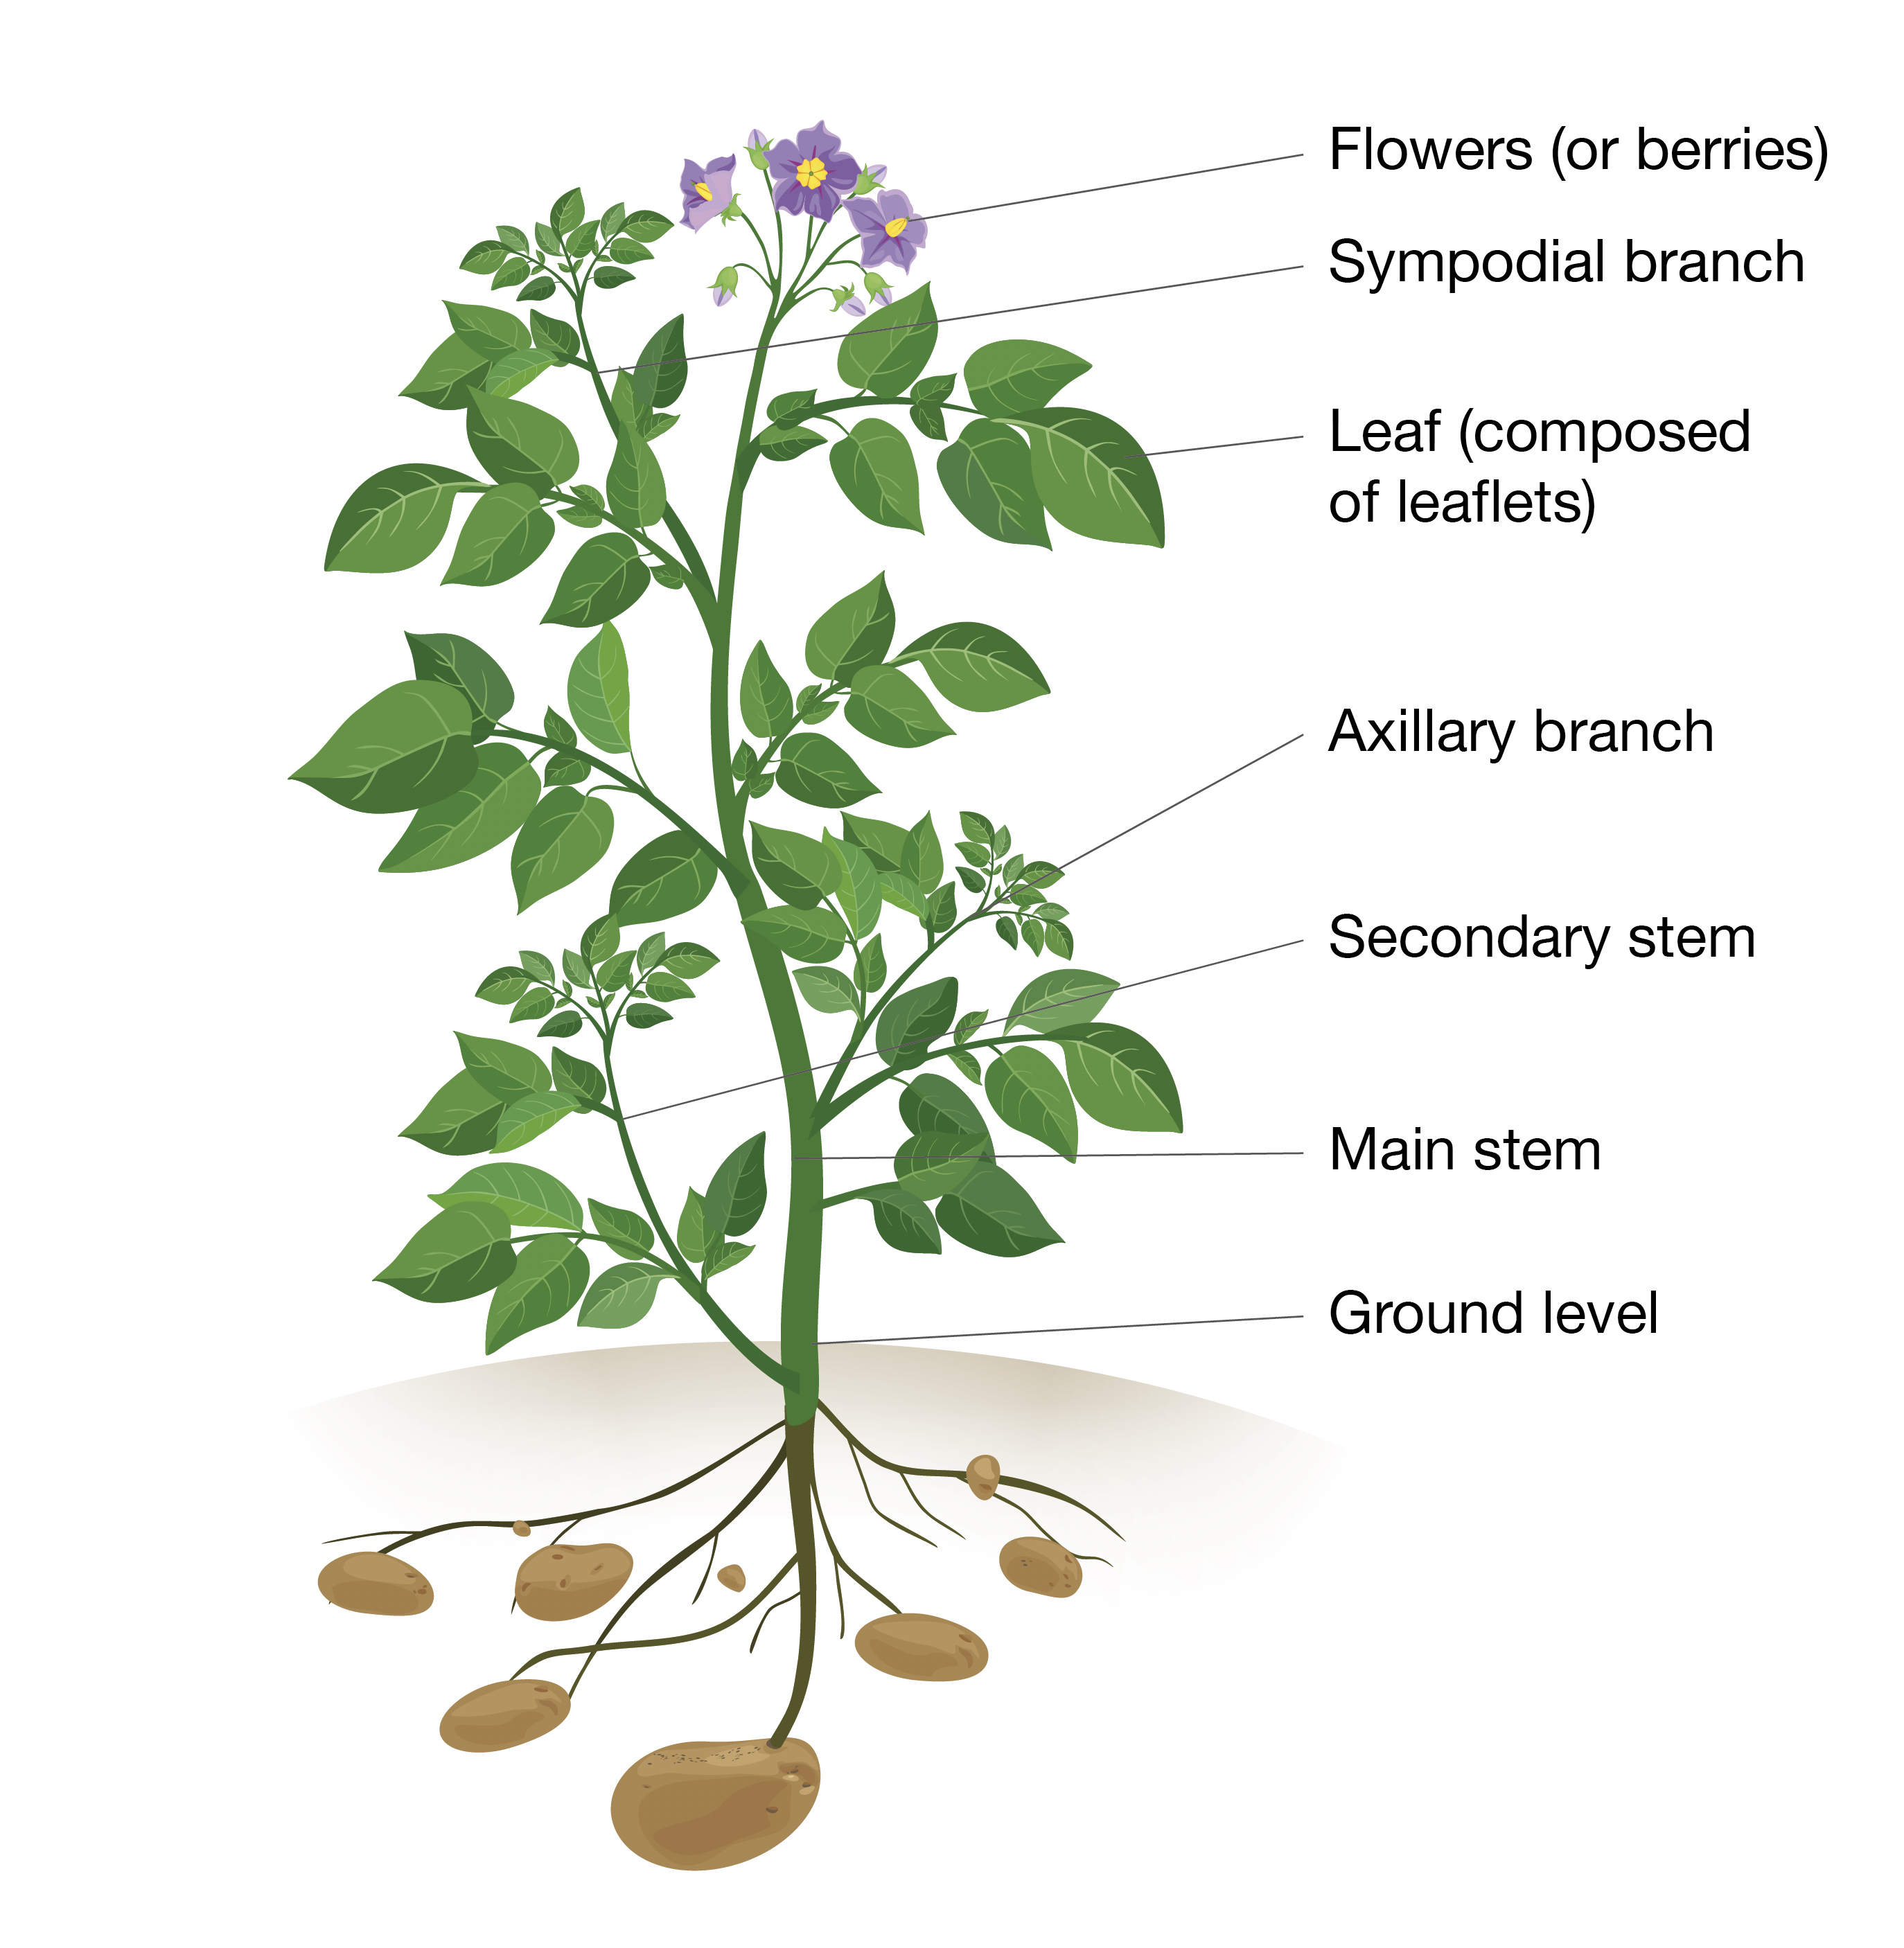
Figure 1. Simplified structure of a typical potato plant
Figure 1 is simplified to illustrate the key structures to identify. This stem shown has six above ground leaves, whereas a more typical stem may have 12–20 leaves.
Please note:
The method relies on counting the maximum number of leaves produced by the variety and, therefore, counting is best done when the crop is just starting to senescence naturally and leaf production/expansion has ceased.
Carry out the counts for your test and reference varieties. Only count the leaves on the main axis of the plant, i.e. leaves on the mainstem and subsequent sympodial branches. Do not count leaves on axillary branches.
Starting at soil level (indicated by a change in colour on the mainstem, see Figure 2a below), count the number of leaves on the mainstem up to the first flower. To maximise light absorption, the leaves are arranged in spiral around the main axis, with an angle of about 138° between leaves. Therefore, on average, there are about five leaves in two complete turns about the stem.
It is likely that the leaves just above ground level will have died at the time of sampling, and in this case count the scar where the leaf was attached instead (Figure 2a).
Similarly, it is also possible that, at the time of counting, the flower will have fallen off, but, by careful counting, it should still be possible to estimate where the flower was located (Figure 2b).
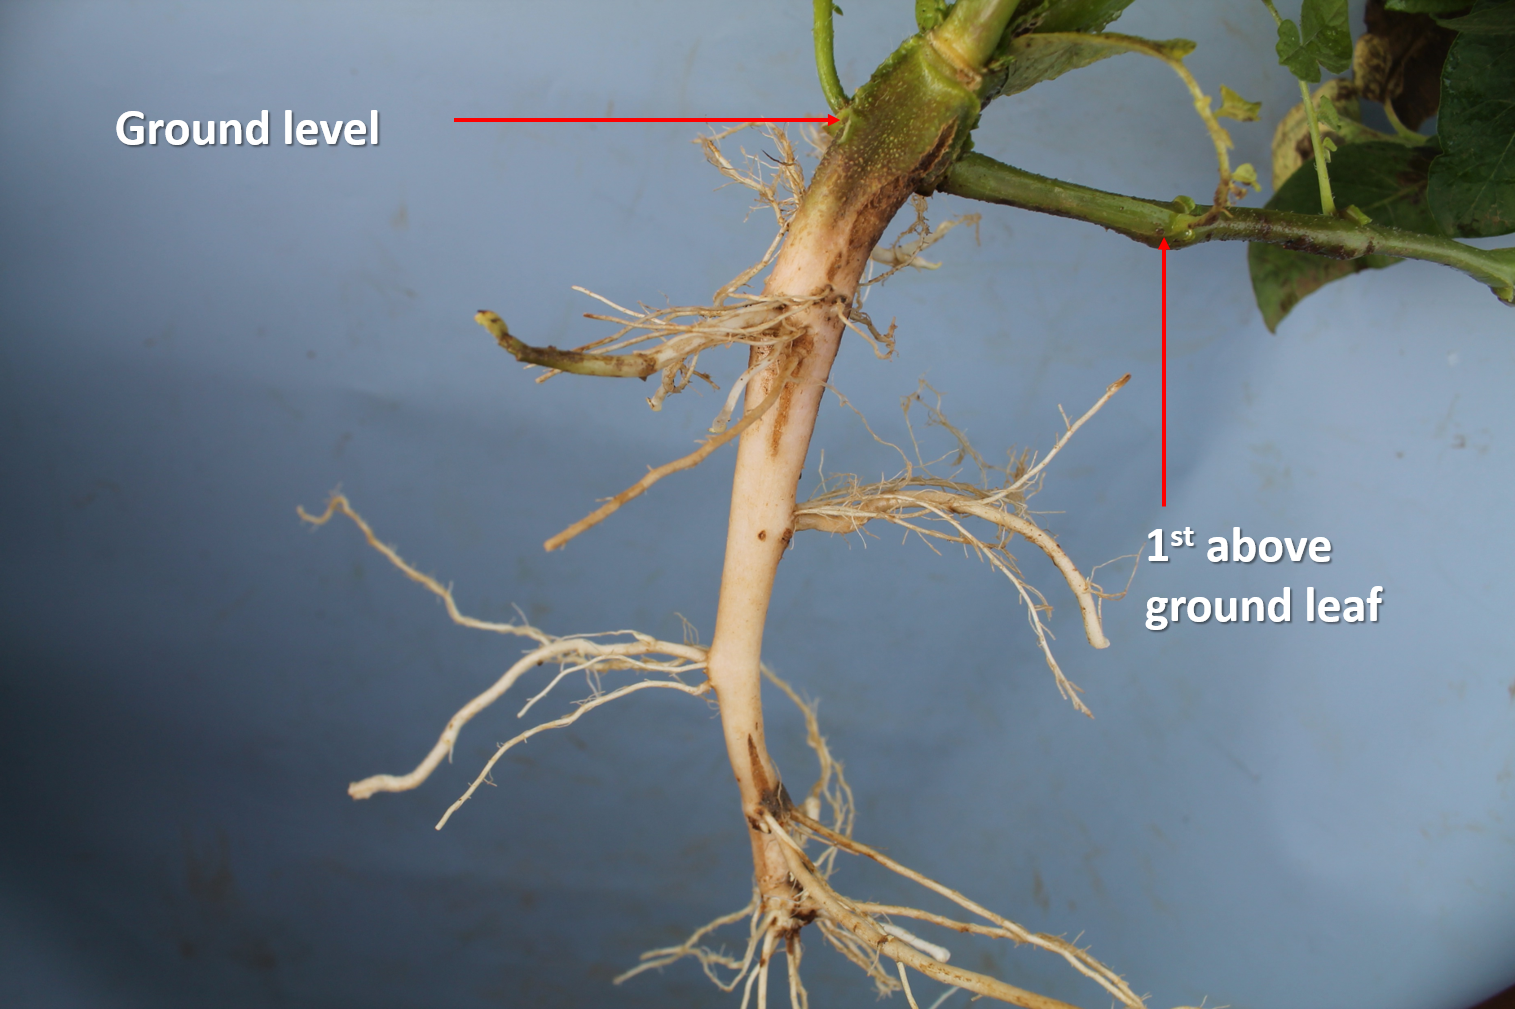
Figure 2a. Position of leaf scar and ground level (variety xx)
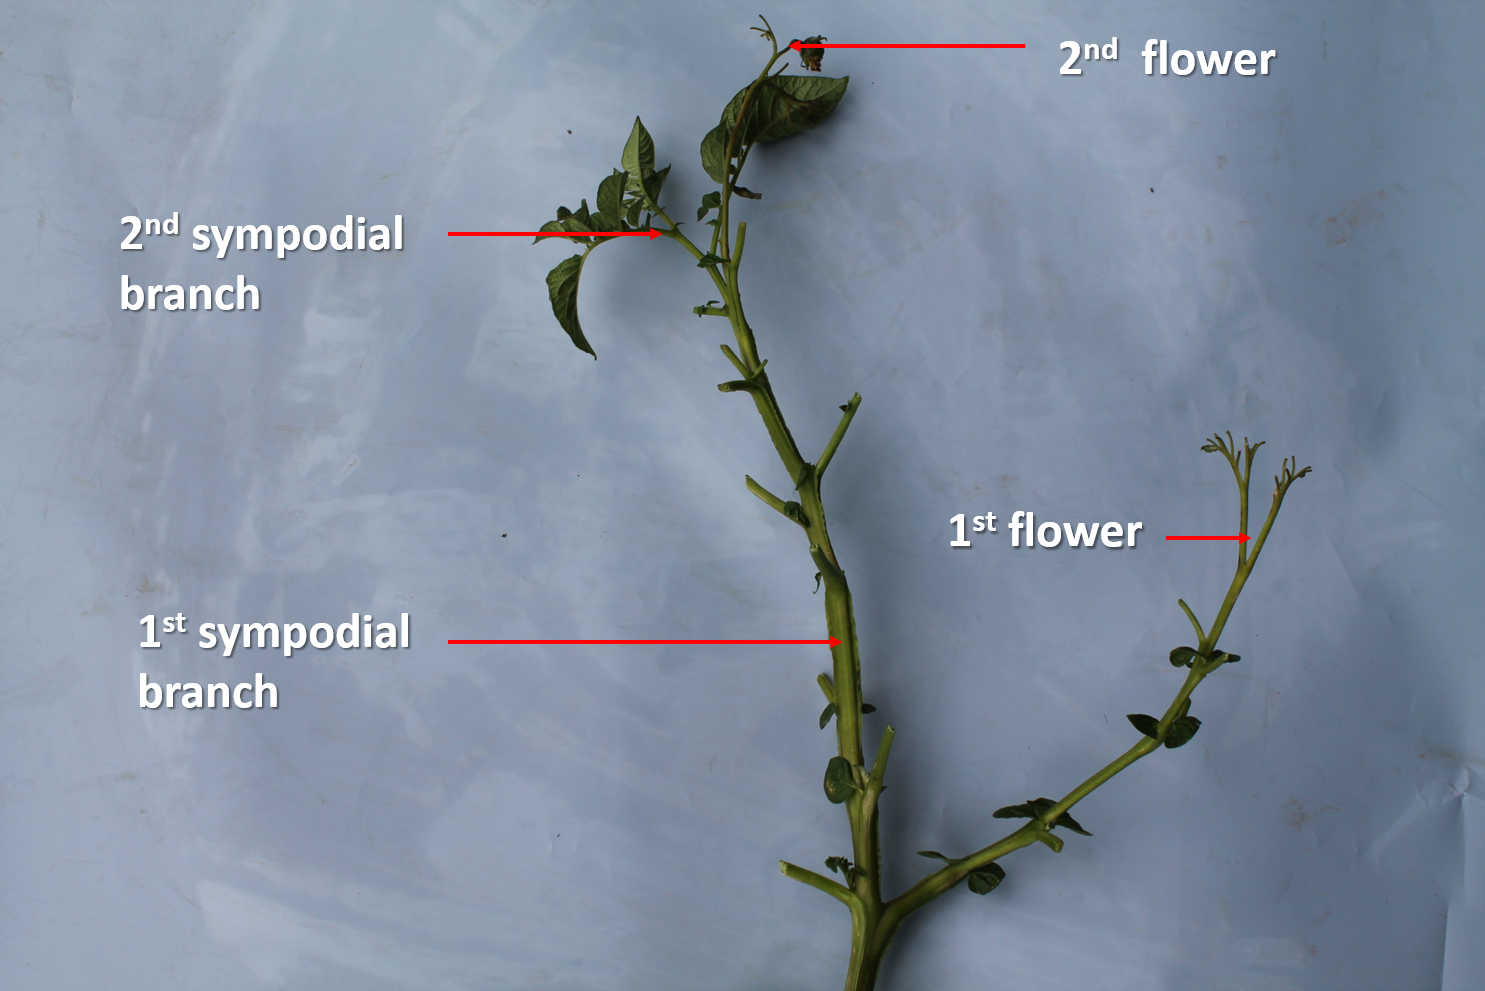
Figure 2b. The remains of the flower and the sympodial branch. Note that the sympodial branch develops from two leaves below the flower (variety xx)
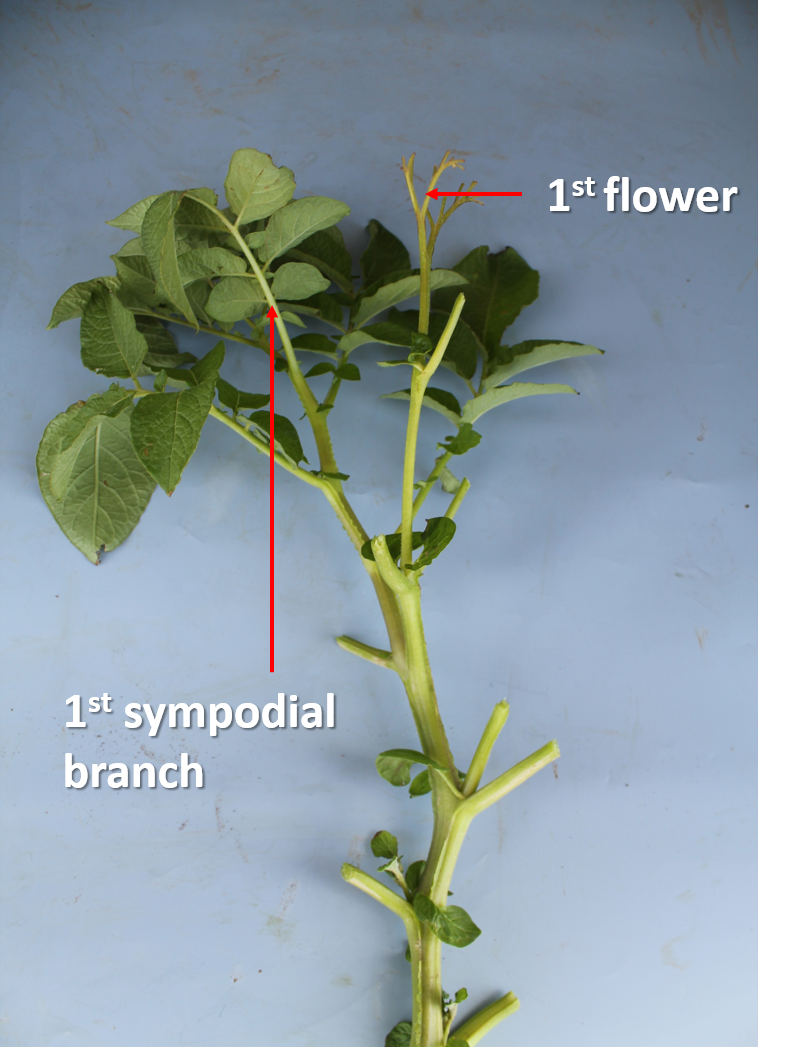
The sympodial branch is typically located two leaves below the flower, but this can vary from one leaf up to three or four. Irrespective of where the sympodial branch is located, count all the leaves on the mainstem to the first flower, and then add on the number of leaves on the sympodial branch(es) (see Figure 3 below).
As you get towards the top of the plant, the leaves will get smaller and more closely bunched together. Only count leaves that are longer than 5 mm.
For guidance, there are typically 18–21 leaves from ground level to the first flower, but, in some varieties, it may be only 10–12.
Repeat the process for the other four stems selected.
Follow the steps below to determine the nitrogen group for your new/test variety. The worked example below uses Estima and Markies as the reference varieties. Please substitute for your Group 1 and Group 4 reference varieties.
|
Varieties grown in similar conditions |
Nitrogen |
Number of main-axis leaves > 5 mm
|
Difference in the number of leaves between the new variety and Group 1 (D) |
Change in number of leaves per increase in nitrogen Group (E) |
Difference in number of leaves converted to change in nitrogen group (F) |
Estimate of nitrogen group of new variety |
Rounding value to nearest whole nitrogen group (G) |
|
Markies |
4 |
38 (A) |
|
= (38 – 19) ÷ (4 – 1) |
|
|
|
|
Estima |
1 |
19 (B) |
|
|
|
|
|
|
New variety |
Unknown |
24 (C) |
= (24 – 19) = 5 |
|
= (5 ÷ 6.3) = 0.8 |
= (1 + 0.8) =1.8 |
2 |
|
Your variety |
|
|
|
|
|
|
|